Water temperature
Drives how much oxygen the water can hold. Warmer water holds less oxygen, so fish are more vulnerable in summer. A sudden rise can indicate a warm wastewater discharge.
Reference: up to 25 °C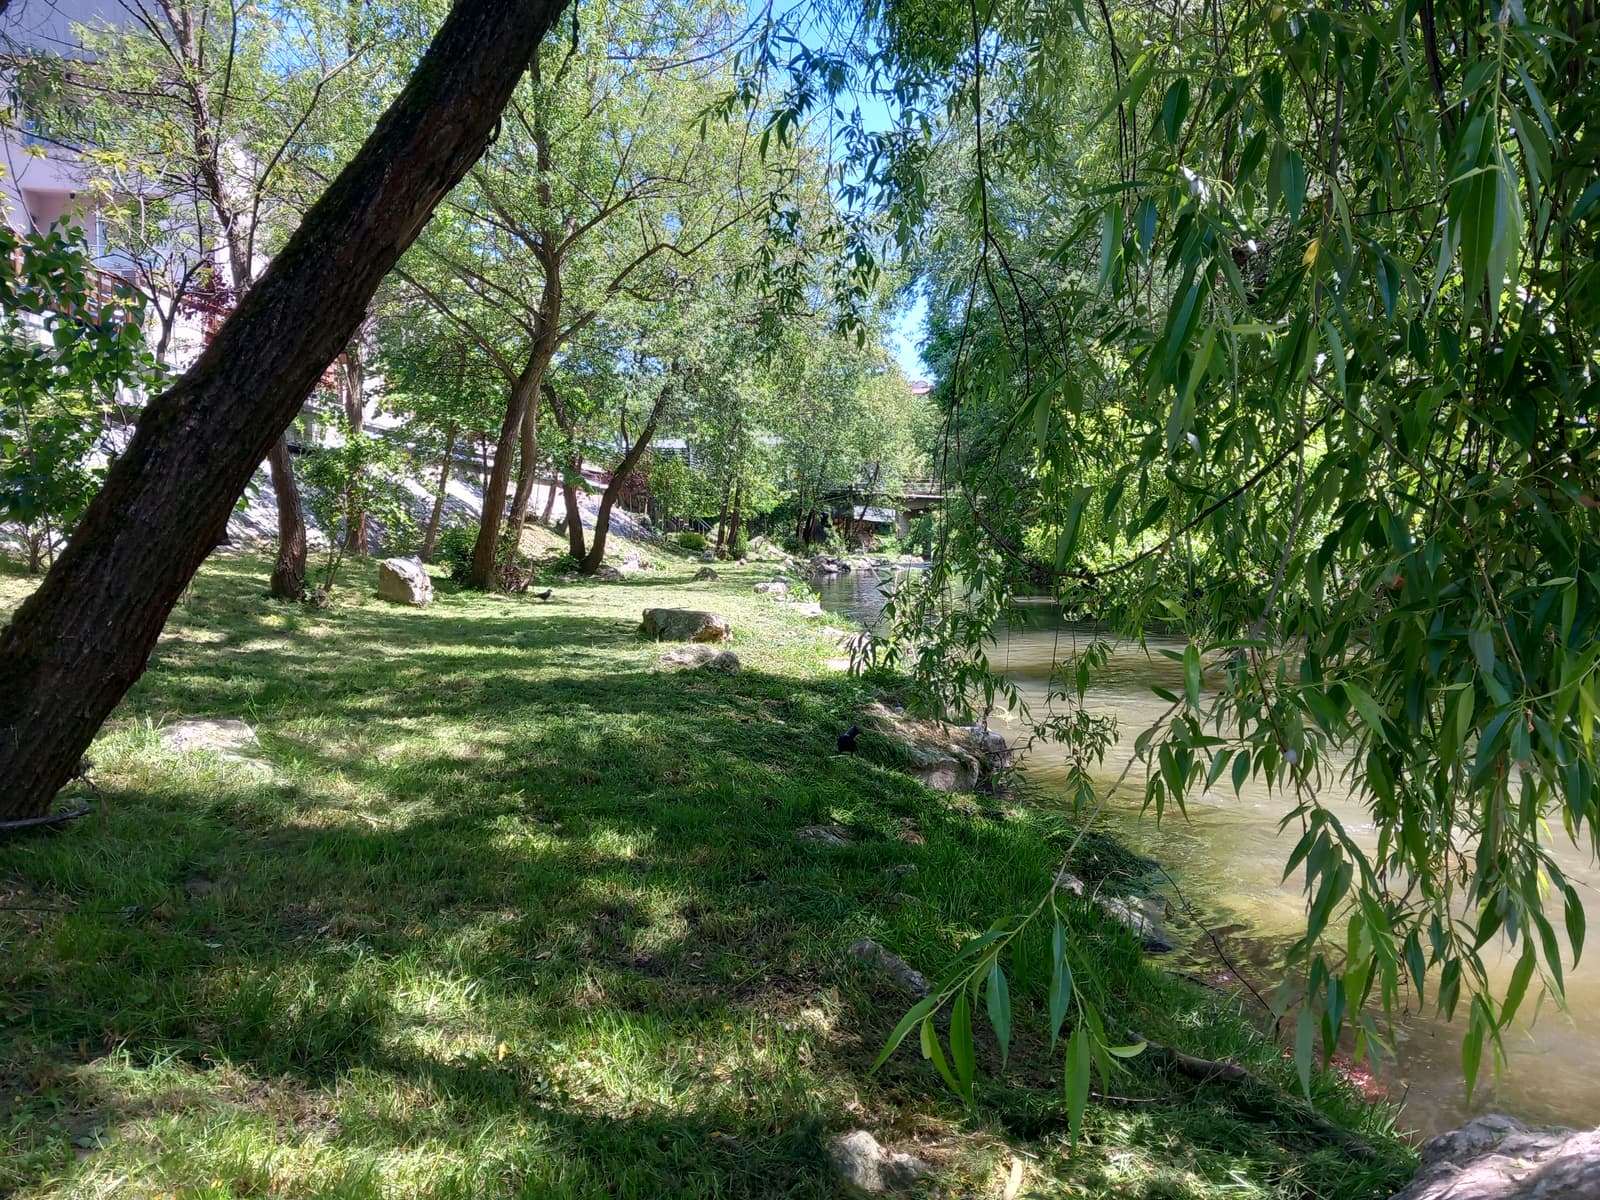
Volunteers of the “Guardians of Đetinja” programme regularly measure water quality at monitoring sites along the river, from Turica to Sevojno. Every reading is submitted through a form and appears on this page immediately. The data refreshes automatically, so what you see always reflects the river's latest state.
Aggregated across all monitoring sites and all measurement dates.
Pick a parameter. Each thin line is one monitoring site; the thick dashed line is the daily average for the whole river.
Click a marker to see that site's results. The number inside the marker is the total count of measurements there.
Drives how much oxygen the water can hold. Warmer water holds less oxygen, so fish are more vulnerable in summer. A sudden rise can indicate a warm wastewater discharge.
Reference: up to 25 °CShows whether the water is acidic or alkaline. Most river organisms survive only in a narrow band — deviations can mean pollution, but also an uncalibrated device, so it is worth repeating the reading.
Reference: 6.5 – 8.5Measures how well the water conducts electricity, which depends on dissolved salts and minerals. A jump downstream of a given point is a classic sign that something is entering the river.
Reference: up to 800 µS/cmThe total amount of dissolved matter. Devices usually derive it from conductivity, so TDS is typically about half the EC value — if it is not, the two values were probably swapped on entry.
Reference: up to 500 ppmNote: measurements are taken by volunteers using handheld pen-tester devices. The results are intended for trend monitoring and awareness, and do not replace official laboratory water testing.
All measurements are publicly available under the CC BY 4.0 licence — use them freely for teaching, student and scientific work, journalism or your own analysis. The only condition is attribution. The data is fully anonymous: no names, no e-mail addresses, nothing by which a volunteer could be identified.
All measurements, parameter definitions, sites with coordinates and computed statistics.
/api/kvalitet-vode.jsonOne row per measurement. Opens directly in Excel, Google Sheets or R.
/api/kvalitet-vode.csvSites as points with averages. Loads into QGIS, ArcGIS or Leaflet.
/api/kvalitet-vode.geojson# Python
import pandas as pd
df = pd.read_csv("https://biorider.rs/api/kvalitet-vode.csv")
df.groupby("naziv_mernog_mesta")["ph"].mean()
# JavaScript
const r = await fetch("https://biorider.rs/api/kvalitet-vode.json");
const { merenja, statistika } = await r.json();
# R
df <- read.csv("https://biorider.rs/api/kvalitet-vode.csv")Licence: CC BY 4.0 · Required attribution: BioRider — Green Mobility CSO, „Čuvari Đetinje“
No degree needed — you get a device, a short training and a monitoring site. Fifteen minutes a week is enough for your point on the map to build its own data series.